The-Dapper-Squirrels

View the Project on GitHub NU-DSS-The-Dapper-Squirrels/The-Dapper-Squirrels
Checkpoint 1
Getting Started
By executing the src/analysis_questions.sql inside postgresql console, the data
query will be processed. You could also copy each query and paste in console.
Our Questions
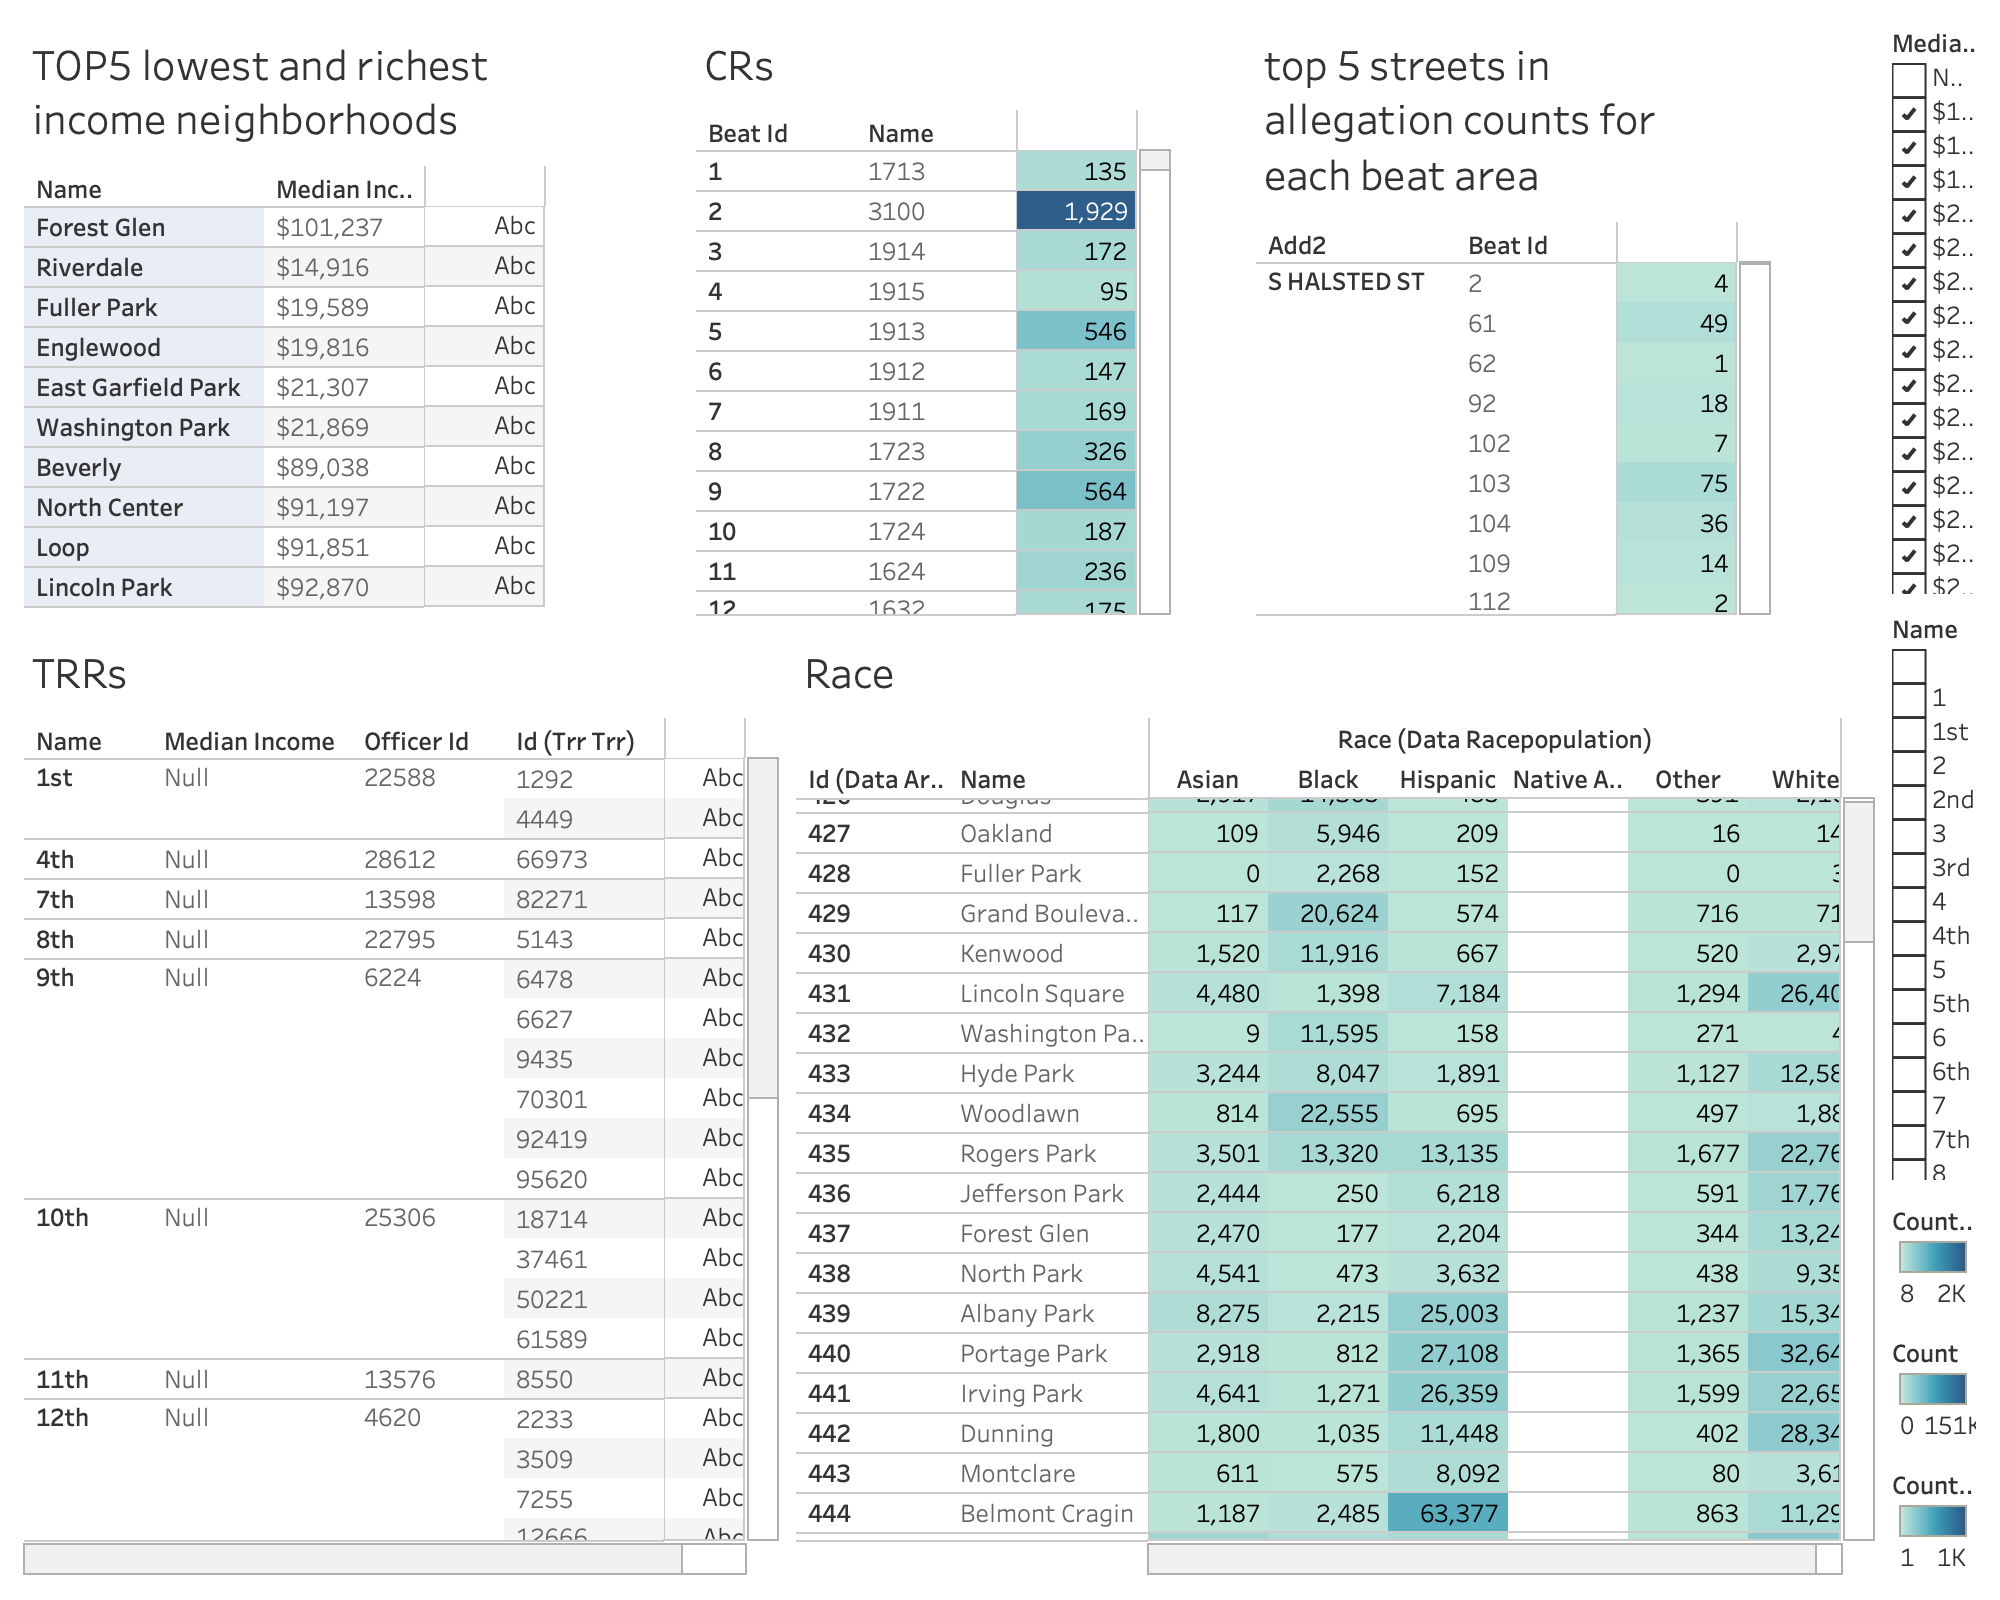
- What are the TOP5 richest and lowest income neighborhoods?
- What are the income and CRs(complaint record) per capita?
- What is the TRRS(tactical response report) per capita?
- What is the percentage of each race in the community?
- What are the top 5 streets in allegation counts for each beat area?
Our Findings
Queries
What are the TOP5 richest and lowest neighborhoods?
- Table of the richest and lowest income:
DROP TABLE IF EXISTS income_ranl;
CREATE TEMP TABLE income_rank AS(
    SELECT richest.rank AS rank,richest.id AS richest_id, richest.name AS richest_name, richest.median_income AS richest_incom,
           lowest.id AS lowest_id, lowest.name AS lowest_name, lowest.median_income AS lowest_incom
    FROM
        (SELECT ROW_NUMBER() OVER(ORDER BY CAST( replace(replace(median_income, '$',''),',','') AS INT )DESC ) AS rank, name, id, median_income
        FROM  data_area
        WHERE median_income IS NOT NULL
        ORDER BY rank
        LIMIT 5) AS richest
        LEFT JOIN
            (SELECT ROW_NUMBER() OVER(ORDER BY CAST( replace(replace(median_income, '$',''),',','') AS INT )ASC ) AS rank, name, id, median_income
            FROM  data_area
            WHERE median_income IS NOT NULL
            ORDER BY rank
            LIMIT 5) AS lowest
        ON richest.rank = lowest.rank
);

SELECT * FROM income_rank;
What are the neighborhoods’ income and CRs(complaint record) per capita?
SELECT dar.median_income,dar.name
FROM data_complainant
    LEFT JOIN data_allegation da ON data_complainant.allegation_id = da.crid
    LEFT JOIN data_area dar On dar.id = da.beat_id
WHERE dar.median_income IS NOT NULL ;
SELECT count(*) AS number_of_complaints, d.name AS beat_name
FROM data_complainant
    LEFT JOIN data_allegation da on data_complainant.allegation_id = da.crid
    LEFT JOIN data_area d on da.beat_id = d.id
group by d.name;
WITH  a AS (SELECT * FROM data_allegation_areas,data_complainant,data_area
WHERE data_complainant.allegation_id=data_allegation_areas.allegation_id
  and data_area.id = data_allegation_areas.area_id
  and data_area.area_type = 'community')
SELECT name, count(*),median_income FROM a
GROUP BY 1,3
ORDER BY 2;
What are the TRRs(tactical response report) per capita?
- For all officers showing in trr table:
SELECT dar.name,dar.median_income,trr_trr.officer_id,trr_trr.id
FROM trr_trr
  LEFT JOIN data_officer dof ON trr_trr.officer_id = dof.id
  LEFT JOIN data_area dar ON dar.commander_id = dof.id
WHERE dar.name IS NOT NULL
What is the percentage of each race in the community.
SELECT id,name,A.race,A.ratio
FROM data_area,
   (SELECT dr.area_id, race, CAST(count AS float)/CAST(total AS float) AS ratio
   FROM data_racepopulation dr,
        (SELECT area_id, sum(count) AS total FROM data_racepopulation GROUP BY area_id) AS population
   WHERE dr.area_id = population.area_id) AS A
WHERE  data_area.id = A.area_id;
What are the top 5 streets in allegation counts for each beat area?
SELECT *
FROM
    (SELECT beat_id, add2, cnt, RANK() OVER(PARTITION BY beat_id ORDER BY cnt DESC) AS rank
    FROM (SELECT beat_id, add2, COUNT(*) AS cnt
        FROM public.data_allegation
        WHERE beat_id IS NOT NULL AND add2 IS NOT NULL
        GROUP BY beat_id, add2
    ) a
) b
WHERE beat_id IS NOT NULL AND add2 IS NOT NULL AND rank <= 5;
What to expect from the data?
Here is a simple visualization of the tables by using Tableau: